
Recently released data from the Office for National Statistics’ Household Finance Survey offers a detailed look at how different forms of housing tenure are spread across income levels in the UK. The findings shine a light on the country’s housing structure - particularly the role of the private rented sector (PRS), which remains a steady and significant feature across all income brackets.
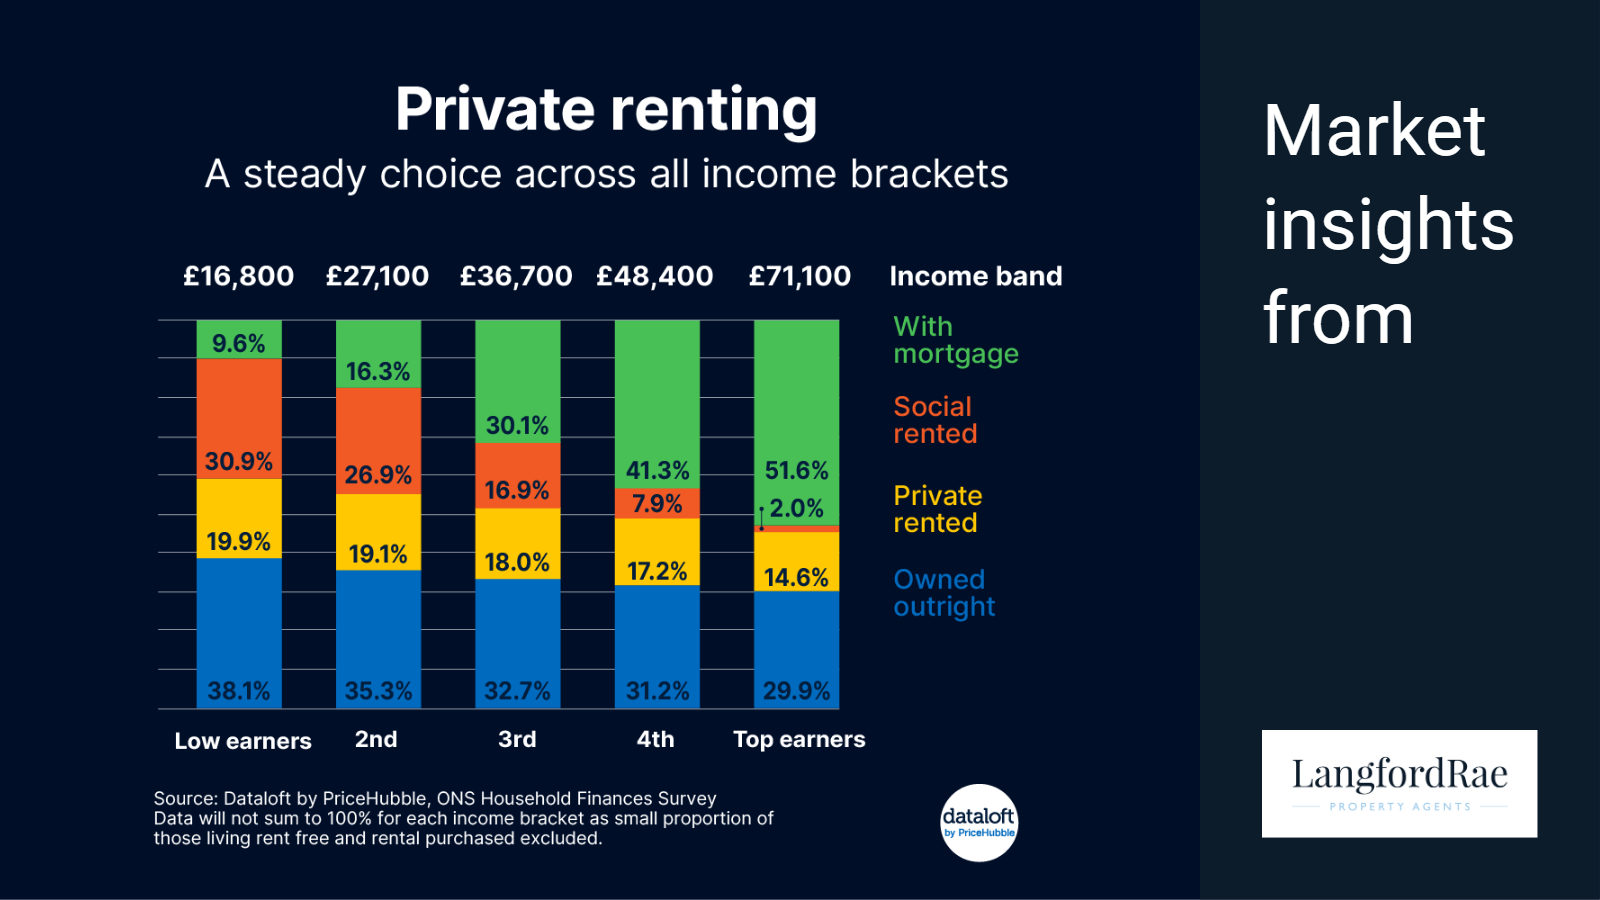
Unlike social rented housing or home ownership with a mortgage, both of which show strong links to income level, private renting displays a remarkable consistency across the income spectrum. Among the lowest-earning households, 19.9% rent privately, compared with 14.6% of top earners - a relatively narrow gap that underscores the broad and adaptable nature of the PRS.
This even distribution suggests that private renting now serves a dual purpose within the UK housing market. For lower and middle-income households, the PRS often represents an essential source of accessible housing, particularly in areas where social housing is limited or waiting lists are long. For higher-income groups, however, it provides flexibility - an option that allows mobility for career or lifestyle reasons without the long-term commitment of ownership.
While affordability pressures are frequently cited as the driving force behind renting, the picture is increasingly complex. A growing number of professionals, especially younger households with higher earnings, choose to rent for reasons of convenience, location, or lifestyle. Renting allows access to desirable areas such as city centres or commuter belts, where buying can be prohibitively expensive. It also offers the freedom to relocate without the transaction costs and delays associated with selling a home.
In contrast, other housing tenures show much clearer stratification by income. The latest ONS data reveal that social renting - where rents are typically below market level and properties are owned by local authorities or housing associations - is heavily concentrated among the lowest earners. Around 30.9% of low-income households live in social housing, compared with just 2% of those in the highest income band. This sharp divide highlights the continuing importance of the social housing sector as a safety net for those priced out of the private market.
Home ownership with a mortgage tells an opposite story. Only 16.3% of the lowest earners own their home with a mortgage, rising steadily to 51.6% among top earners. This strong correlation reflects the financial barriers to entry for many first-time buyers, particularly the challenge of saving for a deposit while covering rent and living costs. Rising mortgage rates over the past two years have also tempered demand and limited affordability, even for households with above-average incomes.
Interestingly, the data also reveal that outright homeownership - owning a property with no mortgage - is relatively consistent across all income groups. At first glance this might seem counterintuitive, but the explanation lies in the age profile of the population. Many outright owners are retired and living on lower current incomes, despite owning valuable housing assets accumulated over decades. This highlights how income data alone can mask the broader wealth inequalities that exist between homeowners and renters.
Taken together, these findings illustrate a housing market that has diversified in both structure and purpose. The private rented sector is no longer a temporary stopgap or a sign of financial struggle; it has become a core component of the housing system, serving people from all walks of life. From young professionals seeking flexibility to downsizers avoiding the burden of ownership, the PRS plays a vital role in meeting the UK’s modern housing needs.
The challenge for policymakers and landlords alike is to ensure that this sector continues to offer quality, security, and value. As the boundaries between traditional tenure groups blur, the enduring appeal of private renting across all income brackets speaks volumes about its relevance in today’s housing landscape.
Source: Dataloft by PriceHubble, ONS Household Finances Survey, data is for 2023/2024. Data will not sum to 100% for each income bracket as small proportion of those living rent free and rental purchased excluded. Household incomes divided into quintiles.
Share this article
More Articles


Sign up for our newsletter
Subscribe to receive the latest property market information to your inbox, full of market knowledge and tips for your home.
You may unsubscribe at any time. See our Privacy Policy.